Remo AI · Benchmarking
PTE & BOQ benchmarking
Know where your estimate sits before the tender goes out.
Remo compares your pre-tender estimate — and your bills of quantities — against projects you have already tendered and awarded. Section by section, in AED per m², adjusted for inflation. Never a pooled market index — only your own history.
Where it fits
Benchmarking is not a one-off report.
The same comparison is worth running at three separate points, because the numbers move between them — and so does the cost of being wrong.
Before the tender
PTE finalisation
Validate the estimate before it is issued. A section sitting 27% above the band is far cheaper to question now than to defend after award.
During the tender
Pre-tender clarifications
Re-run the comparison as clarifications land, so an agreed change is checked against history rather than accepted on its own terms.
Every time it changes
Revisions
Scope and rates drift between revisions. Benchmark each one and the drift is visible as it happens, not at the end.
Matched, not approximated
Against your own projects, section by section.
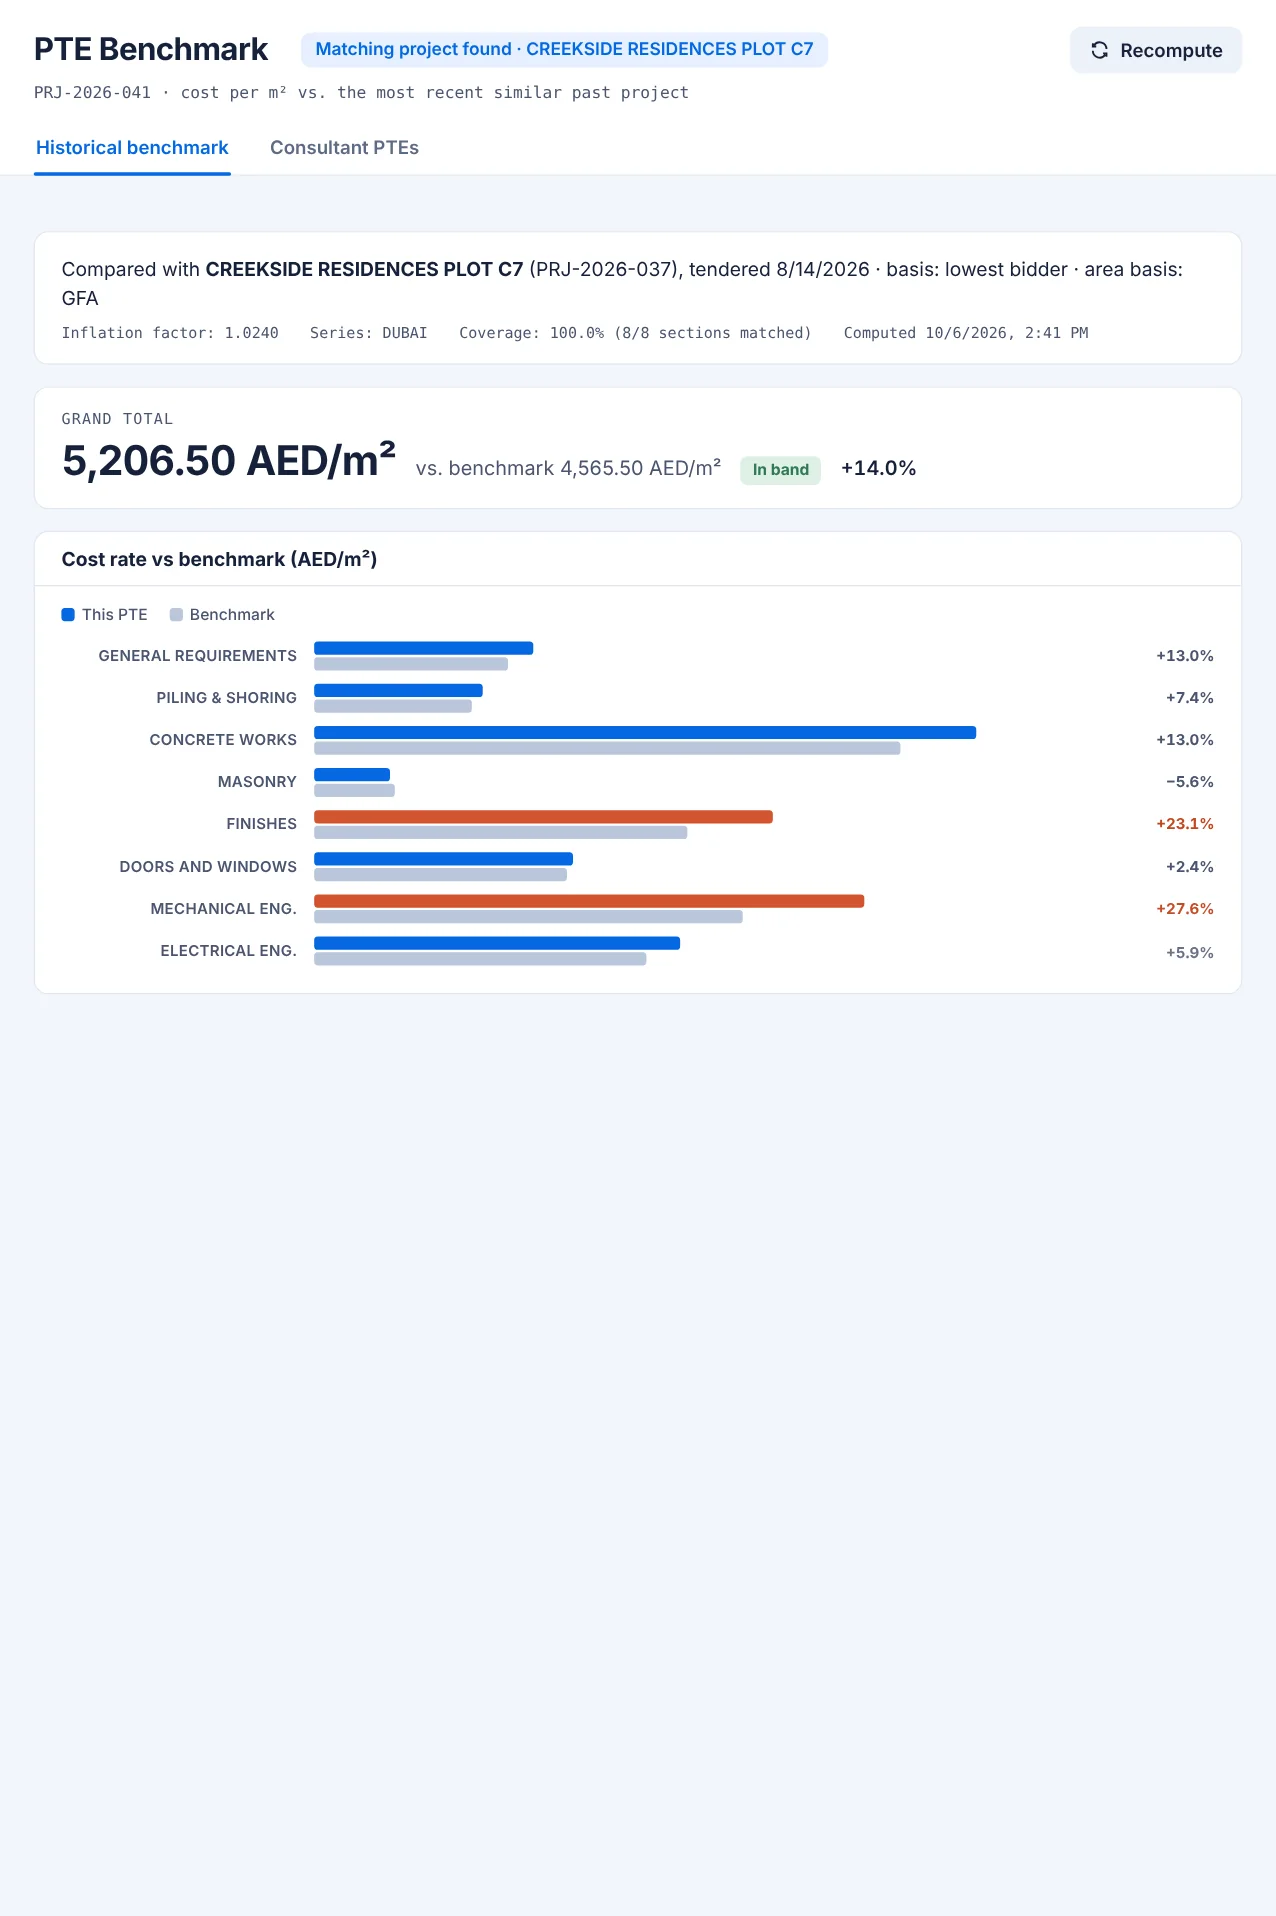
Remo finds the most recent comparable project, maps its sections onto yours, and reports coverage honestly — 8 of 8 matched, or fewer, and it says which.
Adjusted, not raw
An inflation factor and a regional series are applied, so a 2024 project is a fair comparator for a 2026 one.
On a stated basis
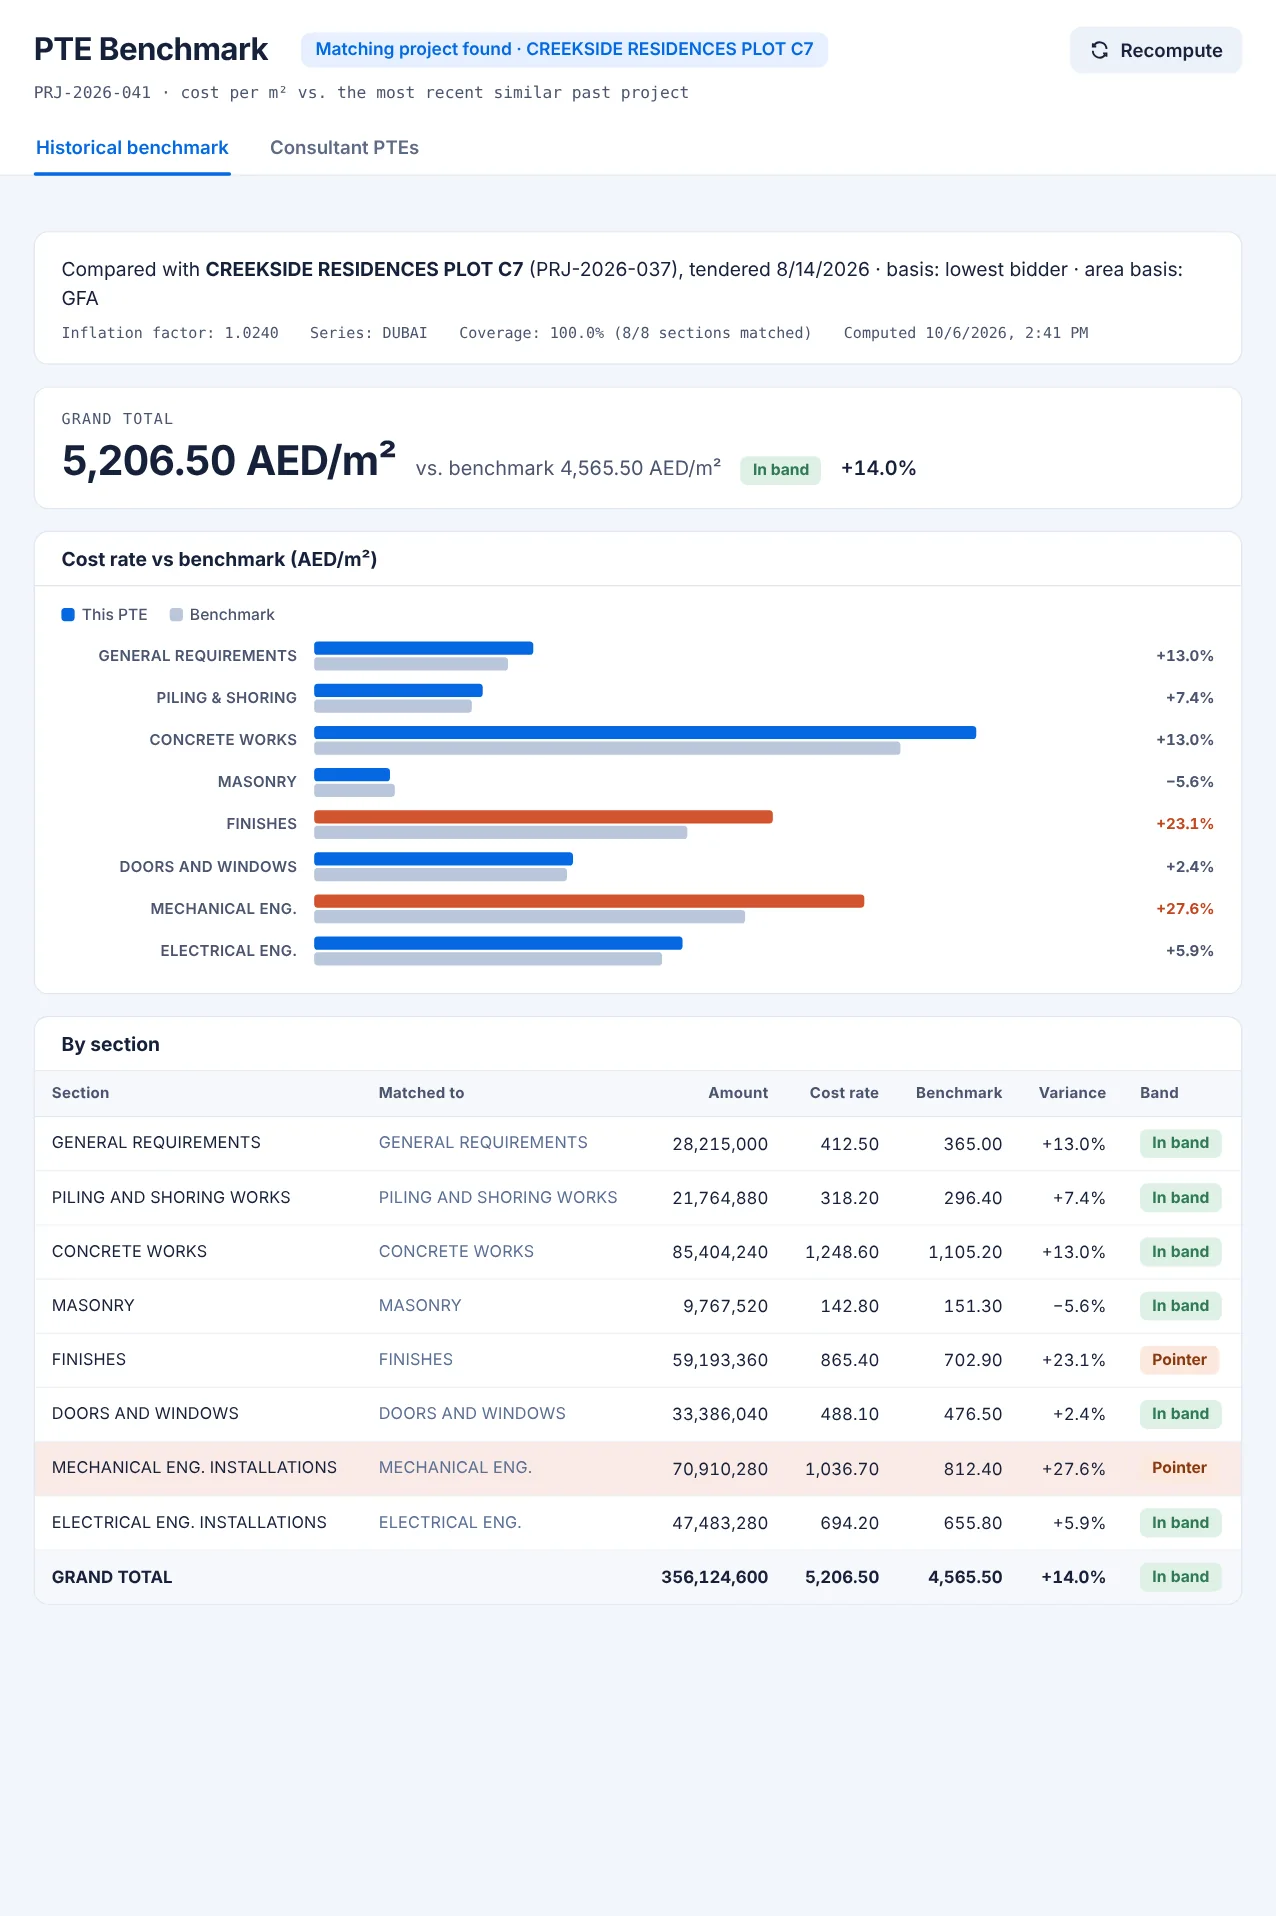
Lowest bidder, area basis GFA, cost per m². The basis is printed on the report, so two people reading it are reading the same thing.
In band, or a pointer
Sections inside the expected range are marked in band. The ones outside it are flagged as pointers to investigate — not verdicts.
Down to the amount
Each section carries its amount, its cost rate, the benchmark rate and the variance, so a finding can be checked rather than believed.
More than one estimate
When several consultants price the same job.
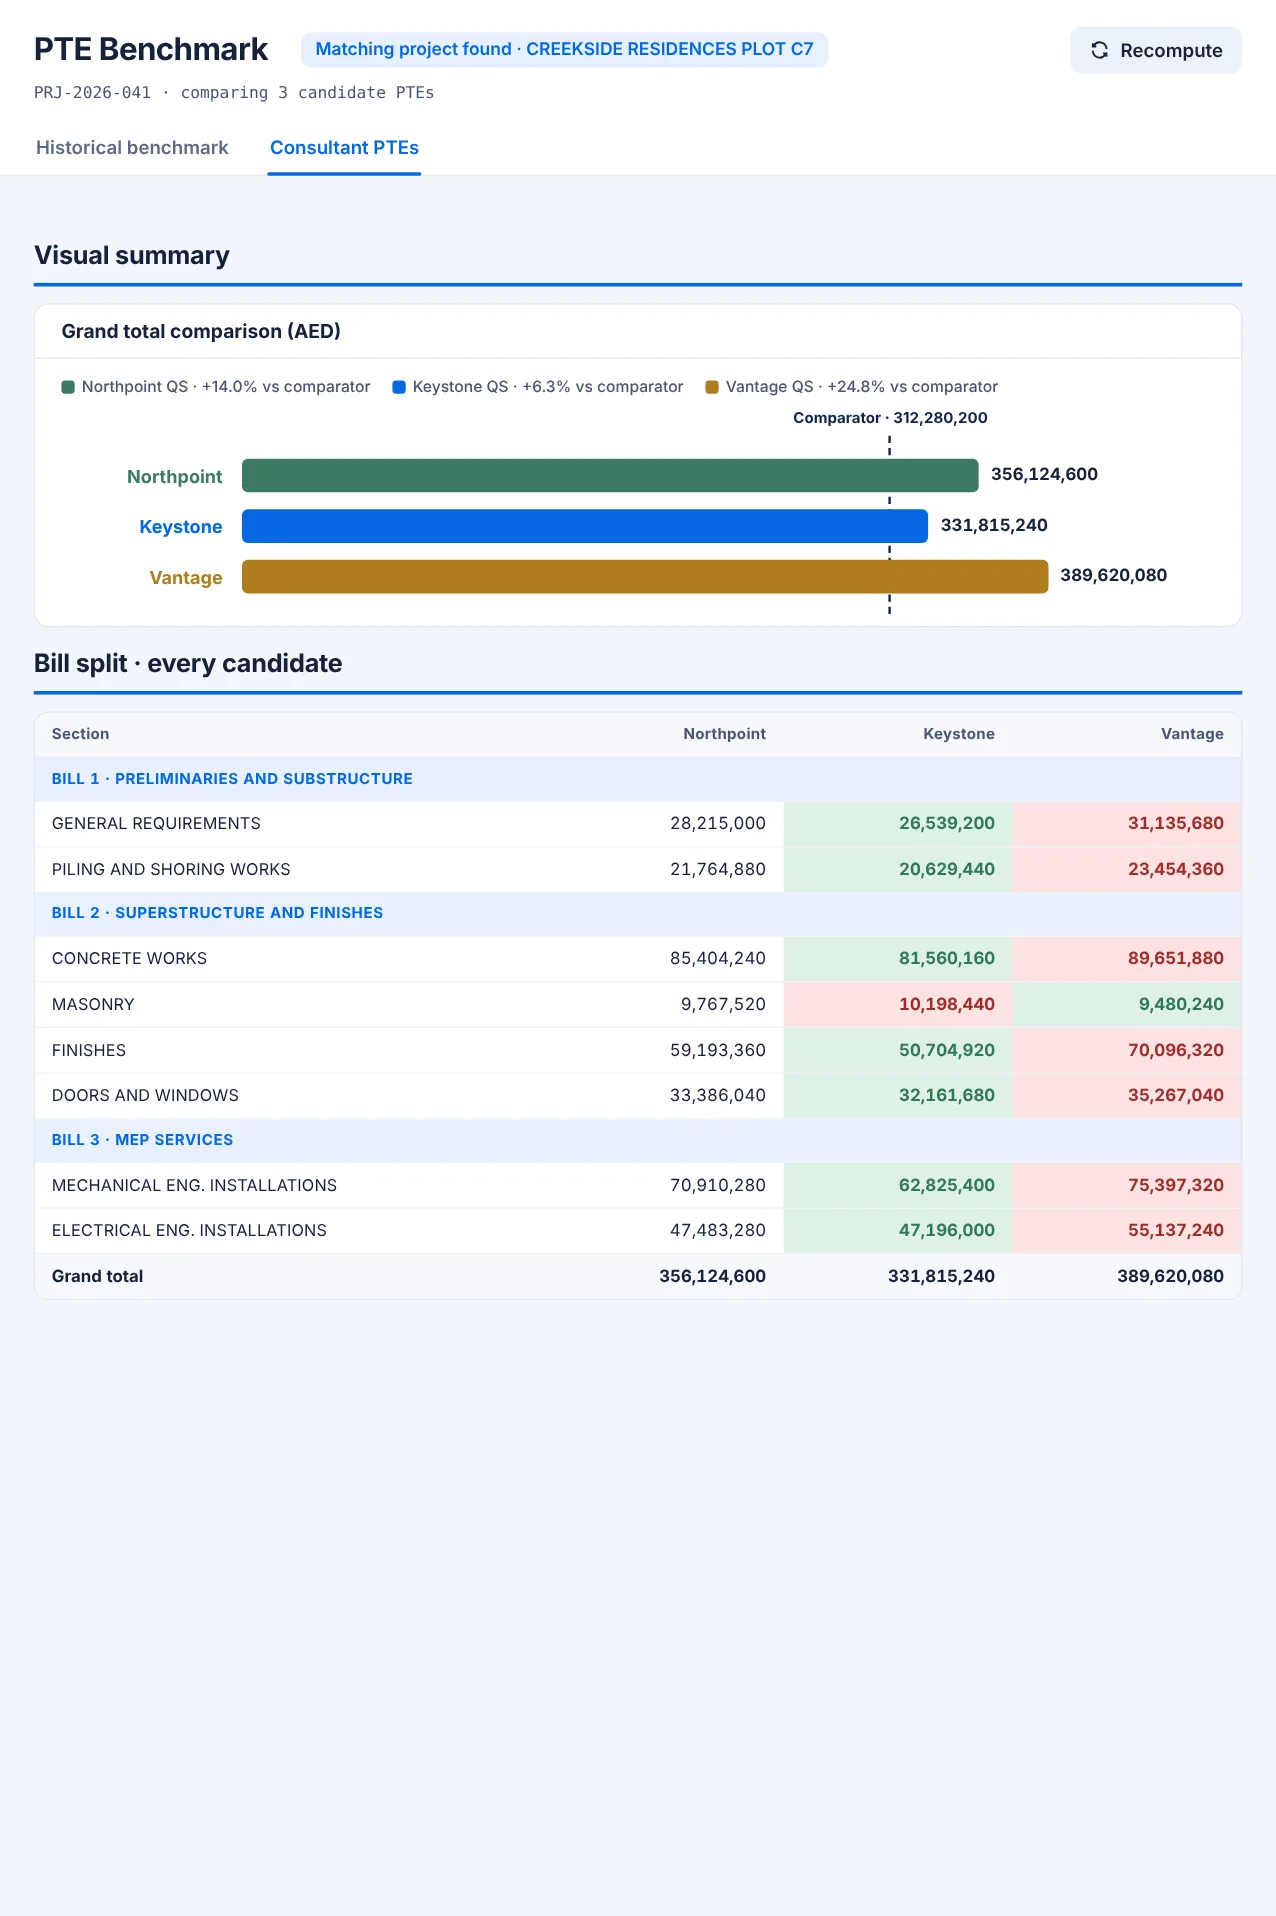
Candidate PTEs rarely disagree evenly. Put side by side against the same comparator, the disagreement localises — usually to one or two bills — and that is where the conversation should happen.
Each candidate is shown against the comparator and against the others, bill by bill and section by section, so you can see whether one estimate is high overall or high in one place.
In motion
A benchmark run, end to end.
54 seconds, no sound. A historical benchmark run followed by three candidate PTEs.
Processed to date
The history the benchmark draws on.
Benchmark the estimate you are finalising now.
One live PTE is enough to see what the comparison tells you that a review meeting doesn't.